Automating My Chilli Plant
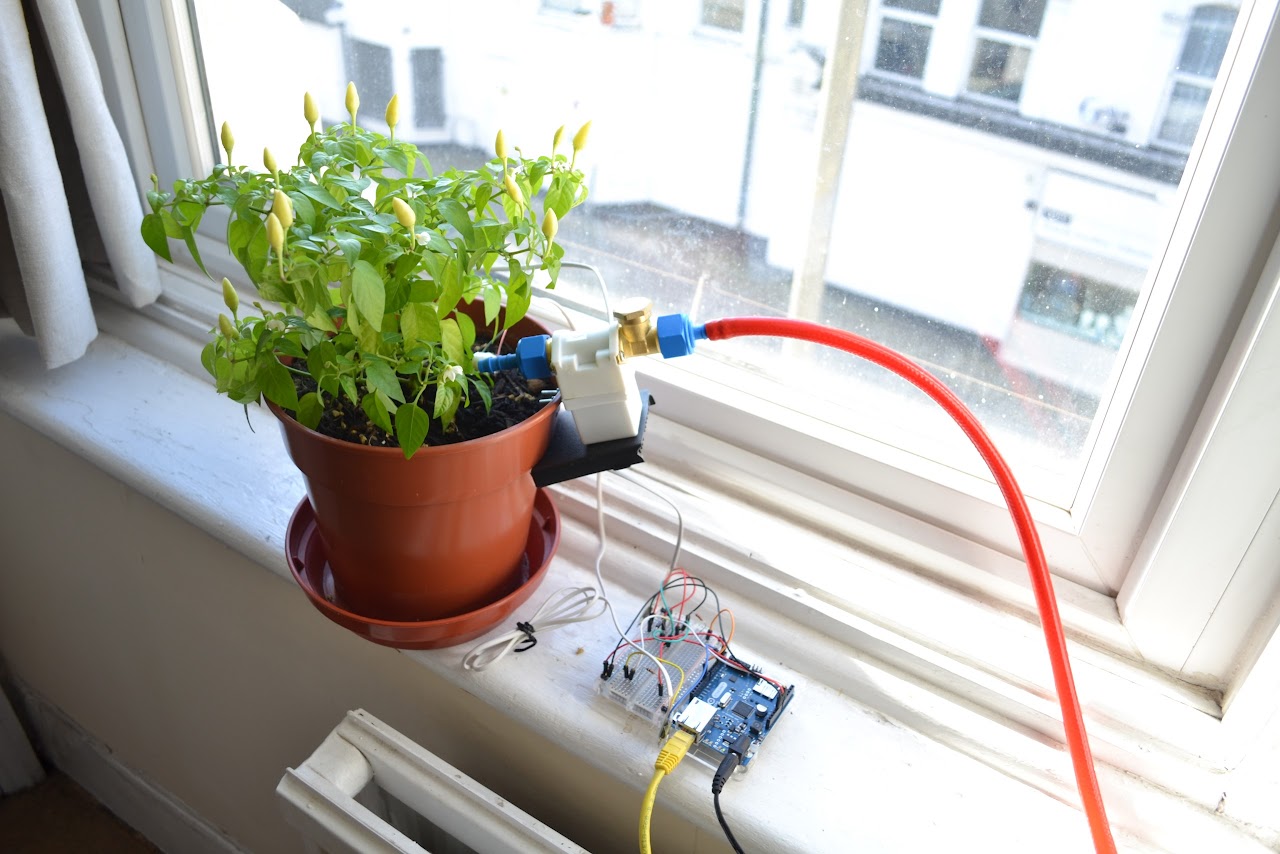
So… I’ve plugged my chilli plant into the internet. Every minute it will report how moist its soil is to a server on the web. Below is a live chart of that data - check it out - you can see exactly how moist my chilli plant is right this second. Wow, this is the sort of stuff the Internet was built for… probably.
The x-axis is time - one pixel per 5 minutes. The y-axis is moisture level in an arbitrary unit - the number is actually a reading of one of the arduino’s analogue pins which has 10 bits of resolution, so it has the theoretical range of 0 - 1023. Saying that if the chart ever reads 0, then my chilli has either been long dead, or I have hi-jacked the arduino for my next project. A normal reading should be somewhere in the range of 400 - 800.
Update 2012-11-05: The Arduino Plant Watering system has been turned off for now, so there are no live charts anymore. The system did it's job, I got some tasty chillis and now I need the arduino for the next project. Instead of the live charts, here's a couple of images to give you an idea of what the live charts looked like. Originally they were lovely interactive HTML5 canvas charts with axes - trust me ;) Check out this git repo for the code behind the live charts.
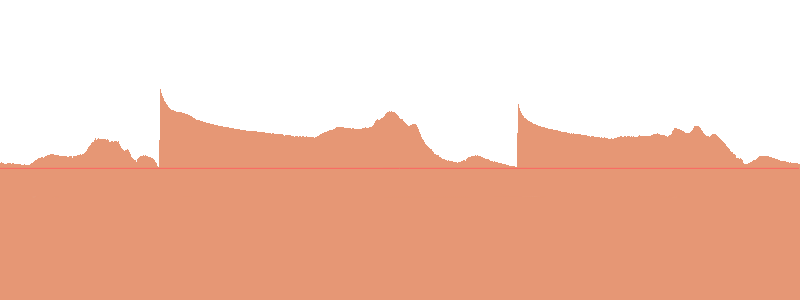
This data is really useful. I have a tendency to over-water plants and this chart would tell me when the soil was dry enough to warrant a watering. Sometimes the soil would look really dry on the surface, but the chart would indicate a lot of moisture beneath the surface. But seeing as the the arduino now already knows how moist the soil is, the next step was to get the plant to water itself and take my over-watering habits out of the equation all together. So that’s what I did. Once the moisture hits a certain threshold, the arduino waters the chilli. At the moment I am using a threshold of `525` `425` 450 which is the red line on the above chart. The below chart indicates events when the chilli has decided to water itself.

The Build
So what’s the hardware and software behind the charts look like?
Hardware
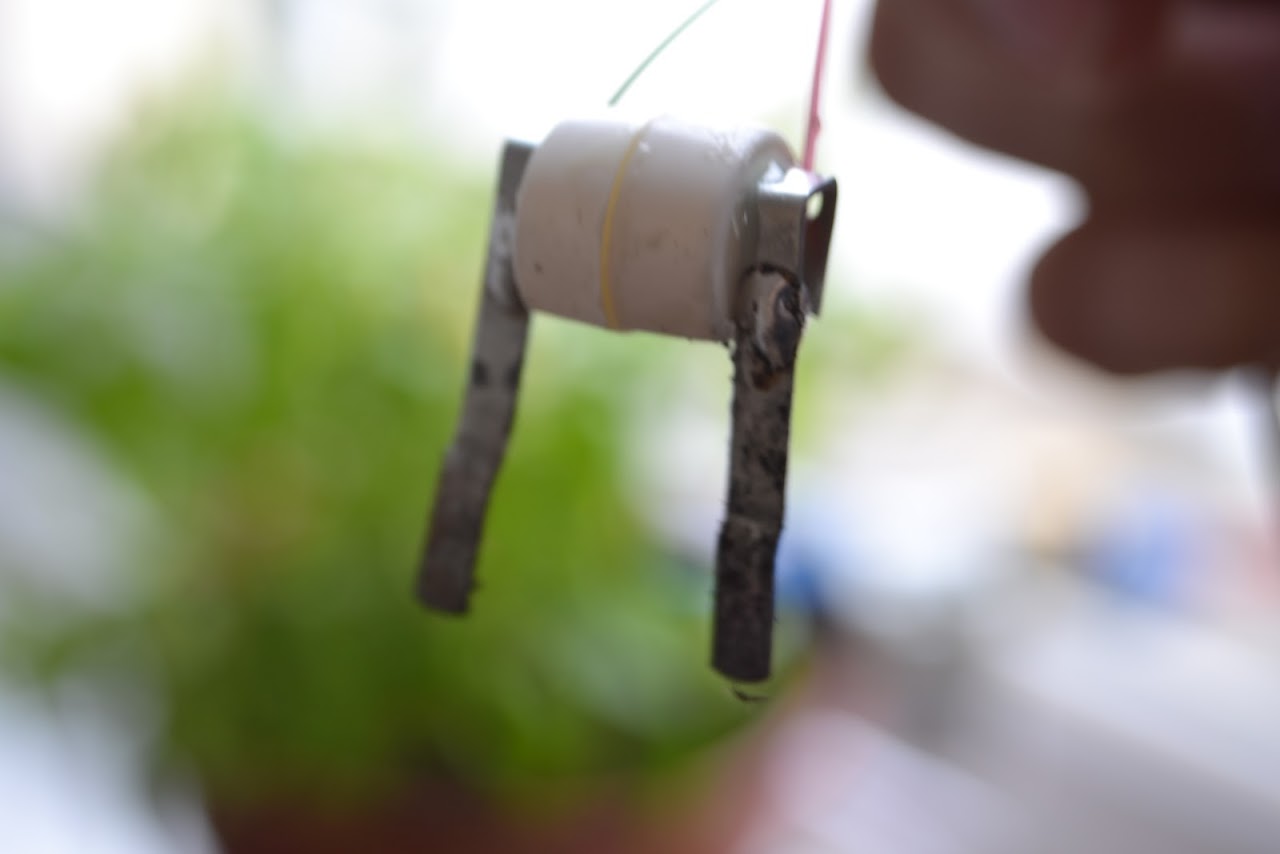
For the moisture recording part of the project I didn’t need to buy any special hardware. As it turns out it is incredibly straightforward, you simply drive a current through two wires poked into the soil and measure the resistance. The less water, the more resistance.
I found some galvanised picture hooks in a toolkit to use as prongs for the sensor. I just had to solder some wire to them and glue them to a small block of plastic to keep them at a consistent distance.
The diagram below shows the circuit. I tried the three different resistors I had to hand and the highest one (10kΩ) seems to work the best.

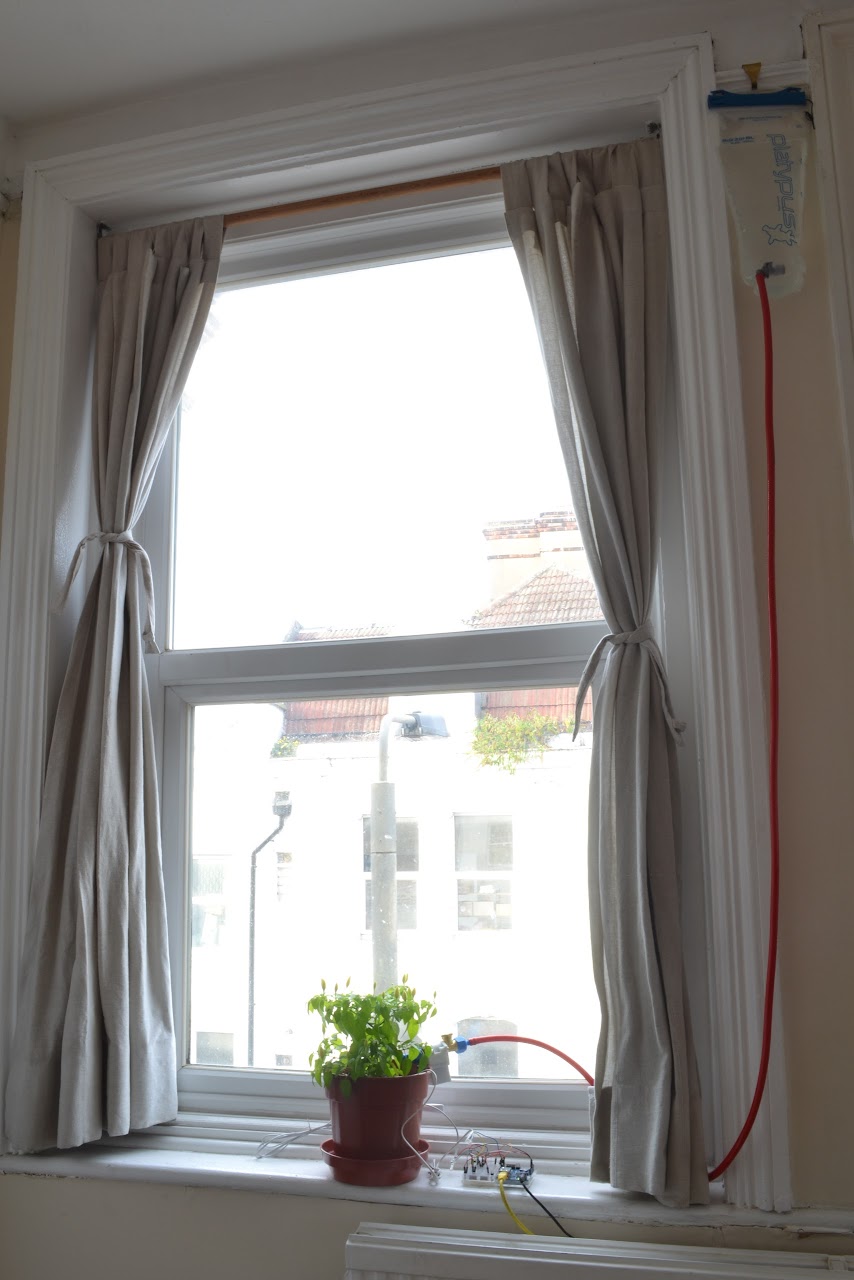
For actually watering the plant I had to buy a bit more gear. I’d seen people do projects like this with mains powered water pumps, but that felt a little overkill to me. I wanted to do it with a simple valve and the power of gravity. I also wanted the valve to be powered via the arduino without having to use an external power supply. I ended up buying this one for 4 quid. Two things to look out for if you are doing a similar project:
- Arduinos support power adapters between 9v and 12v, so get a solenoid valve that operates in this range.
- Check the operating pressure of the valve. The one I bought had a range of 0.02 ~ 0.8Mpa which seemed to work fine for this gravity fed system.
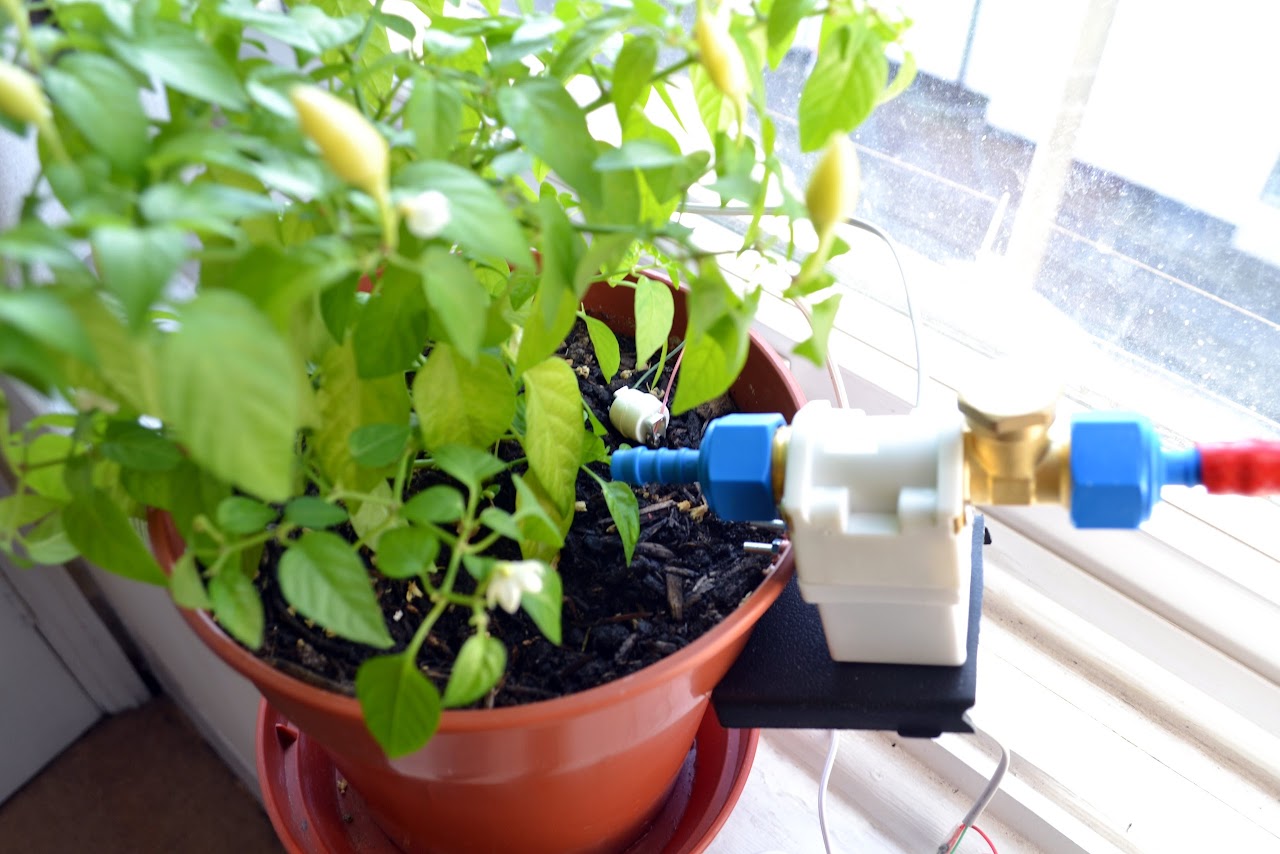
I had the idea of using a hiking hydration system I already had to feed the water, but bought a couple of hose tails and a longer piece of hose to hook everything up.
Below is the circuit diagram for driving the solenoid valve. My electronics knowledge is poor, however I managed to cobble this together from various research and it seems to work. The arduino’s VIN pin gives you access to the the input voltage when using a mains adapter to power the arduino. I used a 12V 1500mA adapter I had in the flat. The diode in parallel with the solenoid is there as a snubber diode.

Software
This project required very little server-side programming. I used cube to store the time-series moisture and watering event data, which uses node.js and mongodb under the hood. As mentioned in their docs, Cube is designed for internal use only so I added a simple proxy using node-http-proxy to lock down write access to the cube server - after all, I don’t want anyone hacking my chilli plant! Cube exposes a RESTful API which my arduino could happily talk thanks to the aJson library. All I had to do was deploy this lot onto a Amazon EC2 instance and the server-side work was done.
For the frontend visualisation I used the cubism JavaScript library which seamlessly integrates with cube. The arduino and cubism code can be found in this github repo - comments/questions/criticism of the code welcome.
Update 2012-01-13: I have written a part 2 blog post which goes into much further detail around how to set up the software for this project. Check it out!
Comments !